Performance testing at Gradle
Performance is one of Gradle’s most important features. This is why we go to great lengths to ensure that Gradle stays fast and improves with every release. I’m proud of the performance testing infrastructure that we’ve built over the last two years and would like to give you a tour of it.
Overview
We have about 150 performance tests in two categories: Regression tests and experiments.
Regression tests compare the current code against a previous version of Gradle. They fail as soon as a statistically relevant difference is detected. Most regression tests are run on every commit and need to pass before a branch can be merged.
Experiments compare different ways of using Gradle, e.g. comparing parallel vs. non-parallel builds or measuring the overhead of the build cache. They can either have hand-picked thresholds like “the cache overhead should be no more than X percent” or no threshold at all, serving only an informational purpose. Most experiments are run once a day, as they usually excercise more complex scenarios that take longer to run.
The tests are distributed over a farm of build agents to achieve an acceptable execution time.
The test results are stored in a database so we can render historical reports and see both positive and negative trends.
The following graph shows the recent history of how long it takes to run gradle idea on a 500-subproject Java build.
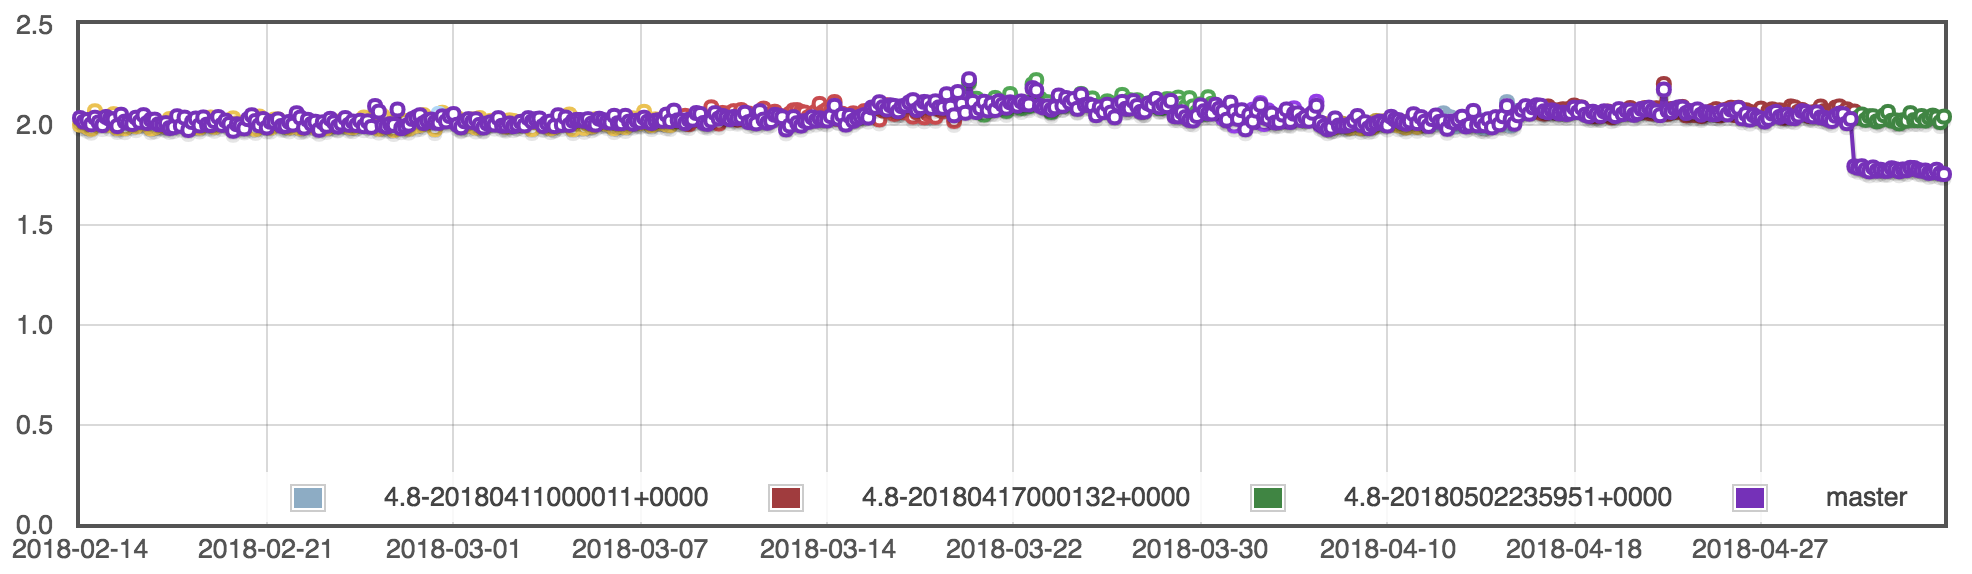
Once a week, we run a historical build that compares the current version of Gradle against a wide selection of older versions. This shows us the bigger picture and allows us to measure how much we’ve improved, not just in the last release, but over the last year or more.
Scenarios
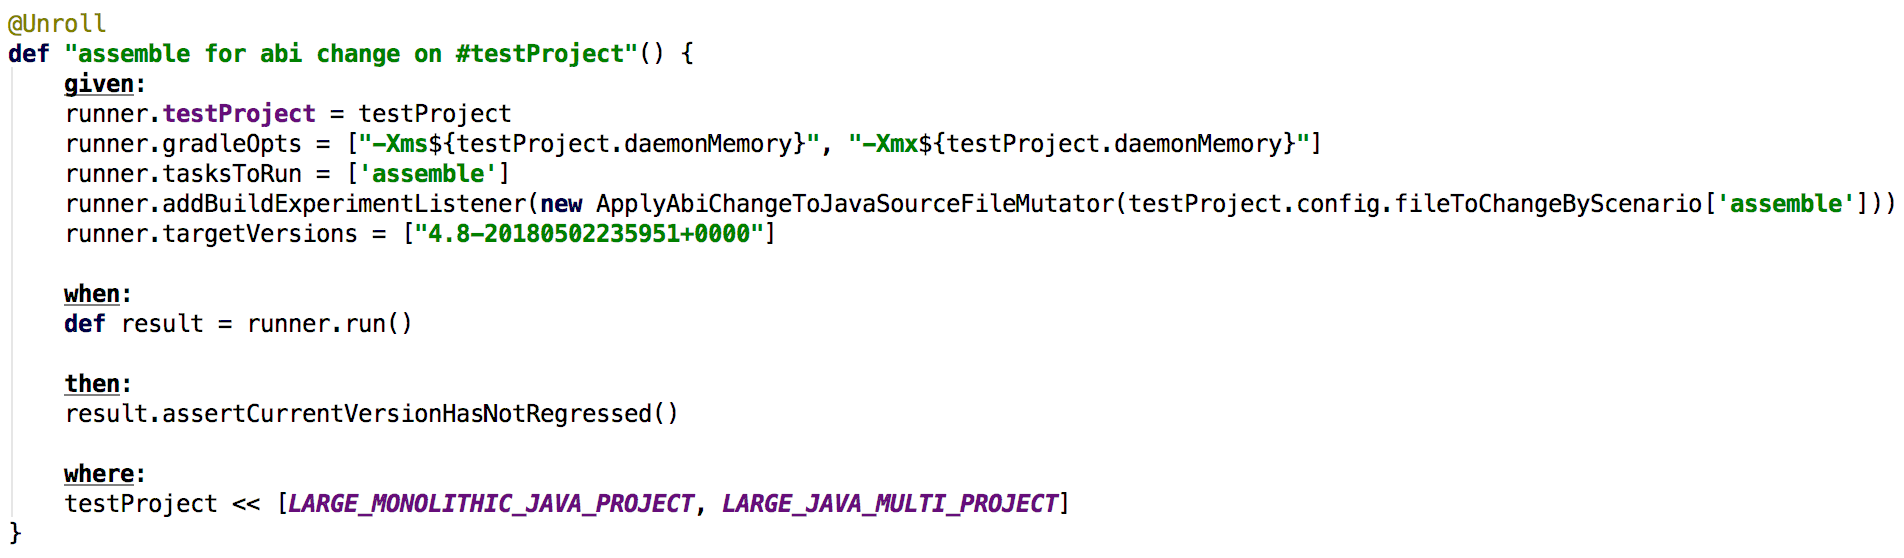
Every scenario consists of a test project and some tasks to run. Some scenarios also do intermediate steps like changing a source file or cleaning the cache. A typical performance test definition might look like this:
There are two kinds of test projects: Fully synthetic and representative.
Fully synthetic projects are generated to show how fast an ideal usage of Gradle can be. They are usually very big and used to explore scaling bottlenecks in Gradle.
Representative projects try to mimic some of the real-world builds we’ve seen at our customers, without exposing any of their proprietary details. These builds give us a reality check on which non-ideal usage patterns we should speed up or prevent.
Distributed execution
Running all our performance scenarios on one machine would take more than half a day. We want to run most of them on every commit, so we need to go much faster. We do this using a “coordinator” build, which discovers all the scenarios and schedules individual builds for each of them. The coordinator uses TeamCity’s REST API to schedule and wait for the scenarios. Once they are finished, the coordinator gets the scenario results and synthesizes a test report. From the TeamCity UI it looks just as if all the tests had run on the same machine. You can browse executed tests, see their execution time and how often they’ve failed in the past.
All the build agents are automatically managed, dedicated servers with exactly the same hardware and software configuration. This ensures that the results are reproducible. The full regression test suite takes about an hour to run, though the target is to get it down to 30 minutes.
Regression detection
For regression tests, we run the current code against a baseline, usually some recent nightly build that is known to be well-performing. Each version gets its own user home, temporary directory etc. to ensure isolation. We even go so far as to pad folder names so that each version under test needs to use the same amount of memory for its file system cache keys.
Each version is given ample warmup time and is then usually measured for 40 iterations. Afterwards, we use a Mann-Whitney u test to determine whether the current version is significantly slower than the baseline. If so, the test fails and someone has to investigate.
We require a confidence of 99%, so there is still a 1% chance that a test may fail due to pure bad luck. This is the price we’re ready to pay in order to detect even the smallest regressions. The infrastructure reliably detects performance regressions of as little as 1%. That means if a commit makes a 5s build just 50ms slower, the performance test will already sound the alarm.
Profiling
It is not always obvious what caused a performance regression. A commit may look unsuspicious at first, but have some unintended side effect. A regression may have gone undetected because it was very small and now another, equally small regression pushed the test over the edge. In both cases, the committer needs more data to find out what the problem is.
For this purpose, we can run any scenario with the Java Flight Recorder attached.
This gives us highly accurate data on CPU usage, memory allocation, file and network IO, and blocked threads.
The data is visualized using the jfr-flamegraph converter
and the FlameGraph tool.
You can zoom and search the stacks and quickly explore both the top-down (flame graph) and bottom-up (icicle graph) resource usage of the version under test.
For instance, here is an icicle graph showing the allocation hot spots when calling gradle help on our own build.
It is a simplified version since the fully detailed one is over 2MB large.
We had recently migrated most of our scripts from Groovy to Kotlin and didn’t see the full performance benefit we expected. A look at the graph quickly shows that inefficient classloader caching was to blame. This analysis took no more than a few minutes and uncovered an issue that may otherwise have led to disappointed users.
For each tested version, we also create a diff against every other tested version. This usually makes it pretty easy to spot where things got slower or faster. For instance, this flame graph diff shows what happened when we removed the rule-based model bridging from projects that aren’t using the rule-based model.
You can clearly see task creation in dark blue, meaning it is much faster now. Red, on the other hand, would mean that something got significantly slower. You can also look at the fully detailed version (1 MB).
Coming to you soon
The flame graphs you saw above will soon be added to the Gradle Profiler, a tool that deserves its own blog post in the future. With it, you’ll be able to easily create the same visualizations for your own performance scenarios. This will allow both plugin authors and build engineers optimize their to algorithms for the fastest possible builds.
The Gradle team will, of course, keep pushing for ever-faster builds. Gradle 4.8 will contain some nice configuration time improvements for large Android builds. These improvements were only possible thanks to JFR snapshots generously provided by our customers and the great work on flame graphs done by Brendan Gregg and Chrishantha Perera. Thank you so much!